
High-Resolution Spatial Metabolomics
Spatial metabolomics integrates mass spectrometry imaging and metabolomics techniques to accurately determine the types, contents and spatial distribution of endogenous and exogenous metabolites in animals, plants, human tissues and cells, and to explain the differences in biological metabolic processes from three dimensions of qualitative, quantitative and localization. According to the trends of the number of papers published in metabolomics, mass spectrometry and spatial metabolomics from 2007 to 2021 (pre-2021), MSI technology is one of the most popular research fields with great potential for development.
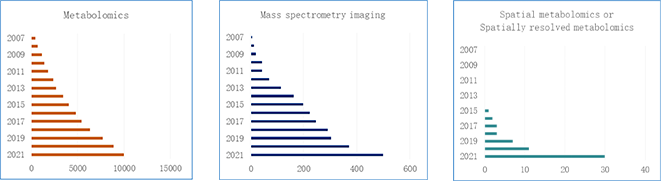 Trends in metabolomics publications from 2007 to 2021
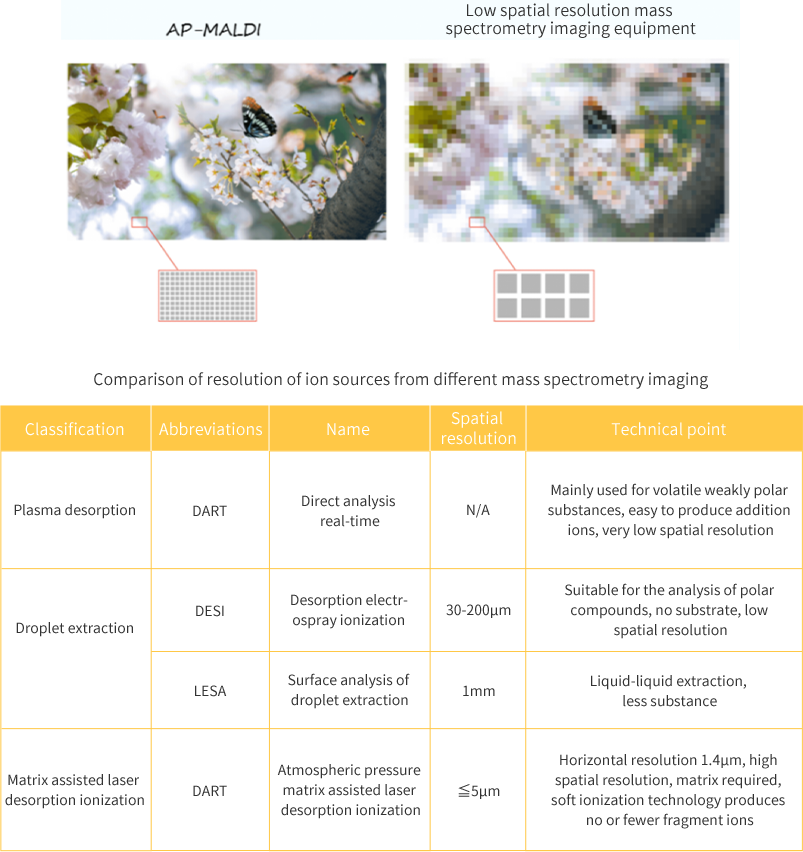
Ion source is the key in mass spectrometry imaging technology. According to different ion sources, MSI is often divided into the following types:
Among them, maldi-msi has become the mainstream and most widely used technology.
The basic principle of maldi-msi is to mix the matrix molecules that can absorb 337nm or 355nm UV laser with the tested object to form eutectic, and use the matrix molecules to absorb laser energy to prevent the excess energy from directly acting on the tested object molecules to fragment them. MALDI technology has the advantages of soft ionization, ultra-high detection sensitivity and good salt tolerance. It is widely used in the analysis of biological macromolecules such as protein and nucleic acid.
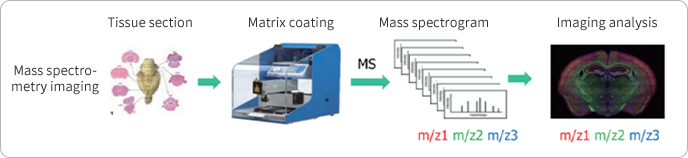
PANOMIX high-resolution spatial metabolome is developed based on mass spectrometry imaging technology and further improved on MALDI-MSI technology. Atmospheric pressure matrix assisted laser / desorption ionization - (AP) MALDI is used as ion source. AP-MALDI MSI technology can obtain high-throughput information of substance composition in the test object, locate the change of target substance in specific space from the dimension of spatial layout accurately, and simulate the substance distribution in three-dimensional space through computer data after multi plane combination, which greatly extends the application field of mass spectrometry, expands the application of mass spectrometry in clinical detection and biopharmaceutical industry, and provides new screening or detection tools.It makes up for the shortcomings of the existing traditional mass spectrometry research, such as the lack of high throughput, the need for markers, complex pretreatment methods and so on.
The average diameter of cells is between 10-20um, and the resolution of PANOMIX high-resolution spatial metabolome can reach 5um, which truly achieves cell-level sampling, and ultra-high resolution brings you the ultimate experience.
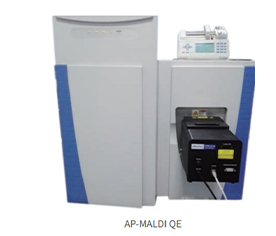
PANOMIX adopts Thermo ScientificTM Q ExactiveTM mass spectrometer, which makes full use of the high-resolution advantage of the mass spectrometer to realize the strong combination of (AP) MALDI + Thermo ScientificTM Q ExactiveTM
The resolution of the back-end mass spectrometer of the mass spectrometry imaging system is also very important. For example, the traditional vacuum MALDI-TOF resolution and linear mode resolution are only a few thousand. In the example below, three different peptides can’t be completely distinguished. Although the reflection mode has a resolution of 20000 ~ 40000, the sensitivity will be greatly reduced due to the longer flight distance and the loss of ion kinetic energy. Through high-resolution mass spectrometry imaging, we can recognize that these three peptides may have completely different physiological functions according to the spatial distribution, so we can avoid cognitive fallacy.

PANOMIX AP-MALDI combined with Q exactive realizes high coverage and sensitive imaging analysis of tissue metabolites, solves the technical problems such as difficult detection of low content metabolites in biological tissues, few coverage types and poor imaging quality, and can realize simultaneous imaging analysis of up to 1000 metabolites, including fatty acids, bile acids, amino acids, flavonoids, neurotransmitters, sugars, carotenoids, vitamins, tannins, phenolic acids, nucleosides, organic acids carbohydrates, etc., restore their spatial distribution information accurately.
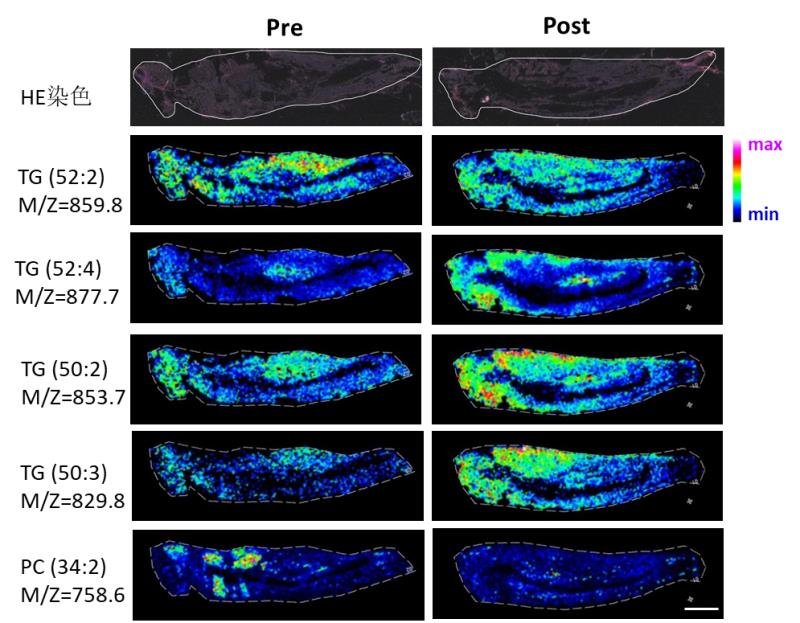 Locusts slice
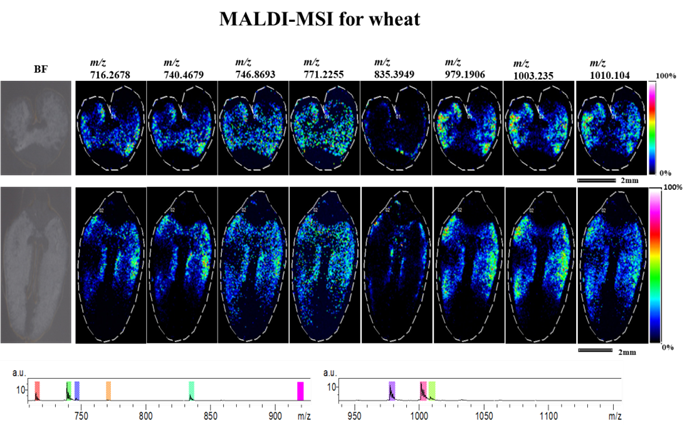 Wheat slice
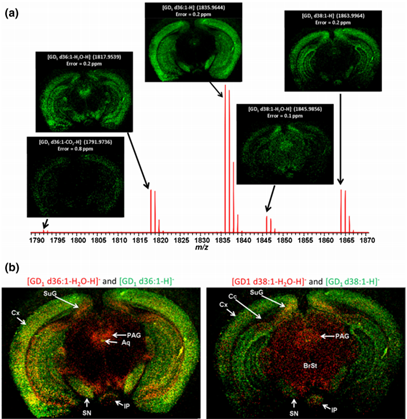 Rat brain ganglioside
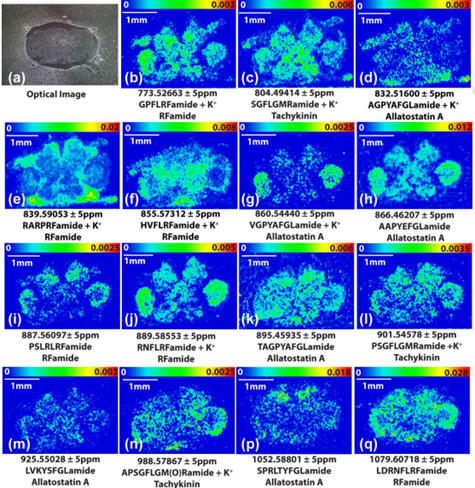 Crustacean brain tissue
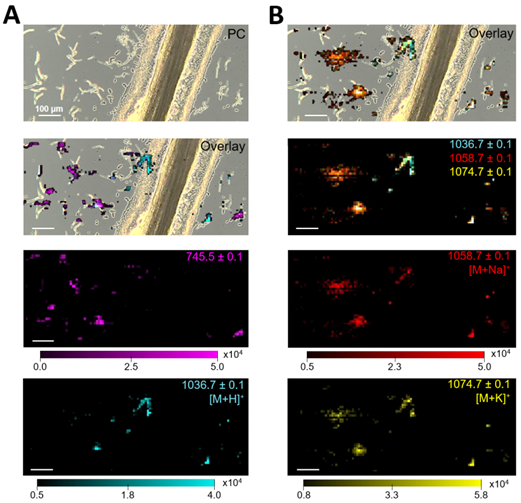 Image of bacillus subtilis microcolony by mass spectrometry
Journal: Talanta(IF=6.057) Published date: 2020
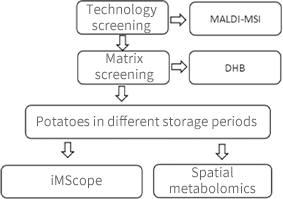
Glycoalkaloids (GAs) are toxic secondary metabolites in potatoes, which are harmful to human body. The storage time has a great influence on the biosynthesis and distribution of GAs. In present study, an imaging mass microscope (iMScope) was used to investigate the distribution and changes of GAs in potato tubers under different storage time (0, 10, 15, 20, 30, 40 and 60 days). We established a growth model with logistic equation to evaluate the growth trends of four major GAs in sprout, periderm and medulla. The results showed that the growth rate and relative contents of four GAs in sprout and periderm were significantly higher than that in medulla. In addition, four GAs also presented different change trends. For dehydrosolanine and α-solanine, rapid growth period of these two GAs in sprout (about at the day 23, similar to these in medulla) was later than which period in periderm (about at the day 17), while rapid growth of dehydrochaconine and α-chaconine appeared at almost the same time (about at the day 20). Based on the biosynthesis and metabolism of GAs, we have made possible explanations for these results. This study is useful for comprehending the metabolism of GAs in different parts and monitoring food safety in potatoes.
1.Methodological investigation
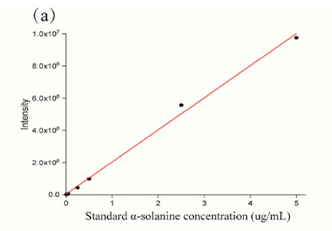
The 2,5-dihydroxybenzoic acid (DHB) matrix expression of different concentrations of α-solanine (0.01-5 μg/mL), the standard curve is shown in Figure 1. This result illustrates the potential of the MALDI-TOF-MSI method for the identification and quantification of GAs in tissue samples.
2.Effects of storage time on the relative content and spatial distribution of gas in different parts of potato tubers
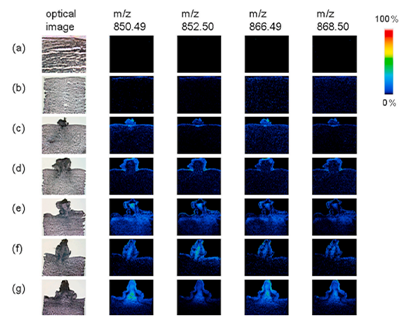
2. Effects of storage time on the relative content and spatial distribution of gas in different parts of potato tubers As shown in Figure 2, we can clearly view the optical image of potato tubers and the four gas distribution: dehydrochaconine ([M + H] + 850.49m / z), α- chaconine([M+H]+852.50m/z),dehydrosolanine([M+H]+866.49 m/z), α- Solanine ([M + H] + 868.50 M / z) is stored in different parts at different times. The morphological changes of potato tuber germination can be directly observed from the optical image.
As seen from figure 2a, the appearance of potato tubers did not change, and almost no four kinds of GAs were detected at the first day . The results showed that under normal storage conditions, fresh potato tubers contained very little . On the 10th day, obvious changes can be observed, as shown in Figure 2B. Four kinds of gas began to biosynthesis and increase, and showed obvious distribution characteristics in potato tuber tissue. In this experiment, the biosynthesis of GAs in tubers mainly occurred in the inner cell layer of pericarp, and it was clearly observed that the pericarp of potato tubers produced GAs before the medulla. From the mass spectrum, these four kinds of GAs are mainly distributed in epidermis and periderm, and the relative content of GAs in periderm is higher than that in medulla. On the 15th day, small buds appeared in potato tubers, forming three obvious areas: bud, pericarp and medulla, as shown in Fig. 2C. The relative content of gas in potato tubers increased significantly, and the distribution was uneven in these three parts. In the color scale of mass spectrum image, the brighter the color, the higher the GAs content in this region. In general, the distribution of the four kinds of GAs in the three parts is basically the same, the content in bud is the highest, the content in pericarp is the second, and the content in medulla is the lowest. From the 20th to 30th day, as shown in Fig. 2D and E, the relative content of four kinds of GAs in the three parts increased rapidly with the growth of buds. At the same time, the distribution characteristics of GAs are still mainly concentrated in the bud and medulla region. In the later stage (40 ~ 60 days), as shown in Fig. 2F and G, the bud grows slowly, and the GAs distribution diffuses to the medulla, but it is still mainly distributed in the bud and periderm area. At the same time, the relative contents of the four kinds of GAs tended to be stable or increased slowly.
3.Construction of gas content growth model

The experimental data of GAs in different parts of potato tuber are shown in Figure 3. The growth rate rose sharply in the initial stage and then it leveled off. The complete trend of GAs growth is similar to the S-shaped curve. The results show that the model is in good agreement with the experimental results. The growth rate of four kinds of GAs in bud and pericarp remained at the same level, which was much higher than that in medulla. The rapid growth period of the four GAs in bud and pericarp was almost earlier than that in medulla. In terms of content, the content of four kinds of GAs is the highest in bud and the lowest in medulla.
The relative content and distribution of GAs in bud, pericarp and medulla of potato tuber are quite different, which may be due to the different intensity of respiratory metabolism in different regions. The activity of respiratory metabolism depends on the presence of substrate, the concentration of respiratory enzymes, and the concentration of oxygen and carbon dioxide. During dormant bud germination, the substrate concentration of respiratory activity of potato tuber bud and pericarp was higher; High concentration of respiratory enzymes; The activity of GAs synthase was high; Oxygen is easily available; and carbon dioxide is easily emitted. However, the concentration of medullary substrate in potato tubers is small, the concentration of respiratory enzymes is low, oxygen is not easy to obtain, and carbon dioxide is not easy to emit. Therefore, GAs is mainly distributed in the bud and pericarp of potato tubers.
Potato tubers were divided into three parts by maldi-tof-msi image, which were in bud, medulla and pericarp α- Streptocarpine and α- The ratios of solanine were 1.59, 1.21 and 1.65, respectively. The results showed that the ratio in medulla was slightly lower than that in other tissues. Because α- The toxicity of carvacaine is higher than that of α- Solanine, so the lower the ratio, the better. Therefore, the content of GAs in medulla and pericarp of potato tuber is low and relatively safe. This is also the reason why many researchers have found that the content and toxicity of GAs in potatoes are greatly reduced after removing potato buds and potato skin.
4.Correlation analysis of four GAs in different tissues of potato

The relationship between the contents of four kinds of GAs in different tissues was verified by correlation analysis. The results showed that the distribution of four kinds of GAs in potato tuber bud, pericarp and bud was significantly correlated. With the extension of storage time, the contents of four kinds of GAs in the three parts had a similar change trend. Four kinds of GAs showed an upward trend in bud and in pericarp and medulla. It is worth noting that dehydrocarcodine and α- The correlation between the change process of Chaco base is low. (blue part in Figure 4). This may be because the content of these two kinds of GAs in medulla is low, the change trend is not obvious, and the correlation is low. This also confirms the previous analysis.
The spatial distribution and changes of four toxic GAs in different parts of potato tubers under different storage time were studied by spatial metabolome technique. The changes of four kinds of GAs with time were observed from morphology and mass spectrometry. Logistic growth model was used to fit the reliable relationship between storage time and GAs intensity. The growth rate and relative content of GAs in different tissue regions are quite different, and different GAs also show different growth trends. Importantly, the possible causes of these results were revealed from the perspective of GAs biosynthesis and metabolism. This study is of great significance to reveal the GAs metabolism of different parts of potato tubers, and can provide guidance for potato storage and food safety monitoring.
Yda B , Mh A , Feng F A , et al. The distribution and changes of glycoalkaloids in potato tubers under different storage time based on MALDI-TOF mass spectrometry imaging[J]. Talanta, 2020, 221.
![]() © Copyright 2015-2022 Suzhou PANOMIX Biomedical Tech Co.,Ltd
© Copyright 2015-2022 Suzhou PANOMIX Biomedical Tech Co.,Ltd